A business intelligence dashboard developed to explore customer behaviour,
sales performance, churn, refunds and regional trends using data visualisation
and reporting techniques within Power BI.
Microsoft Power BIBusiness IntelligenceData VisualisationMicrosoft ExcelKPI ReportingDashboard DesignData Analysis
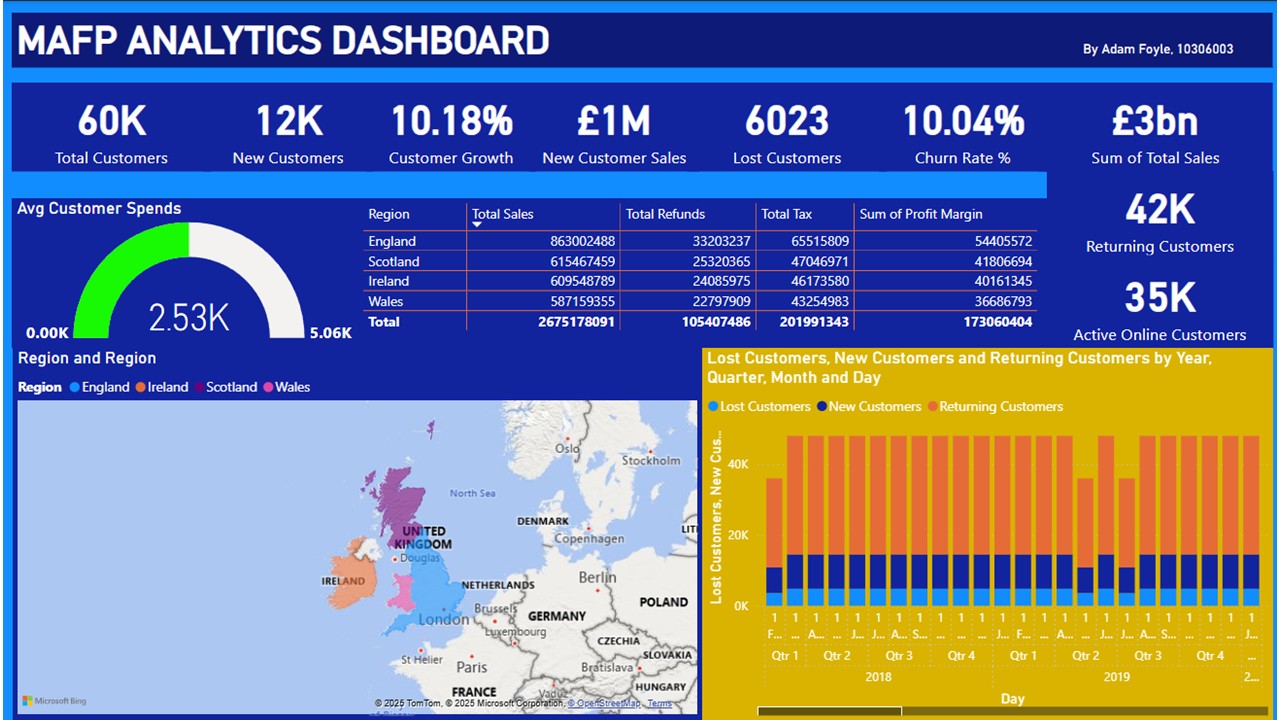
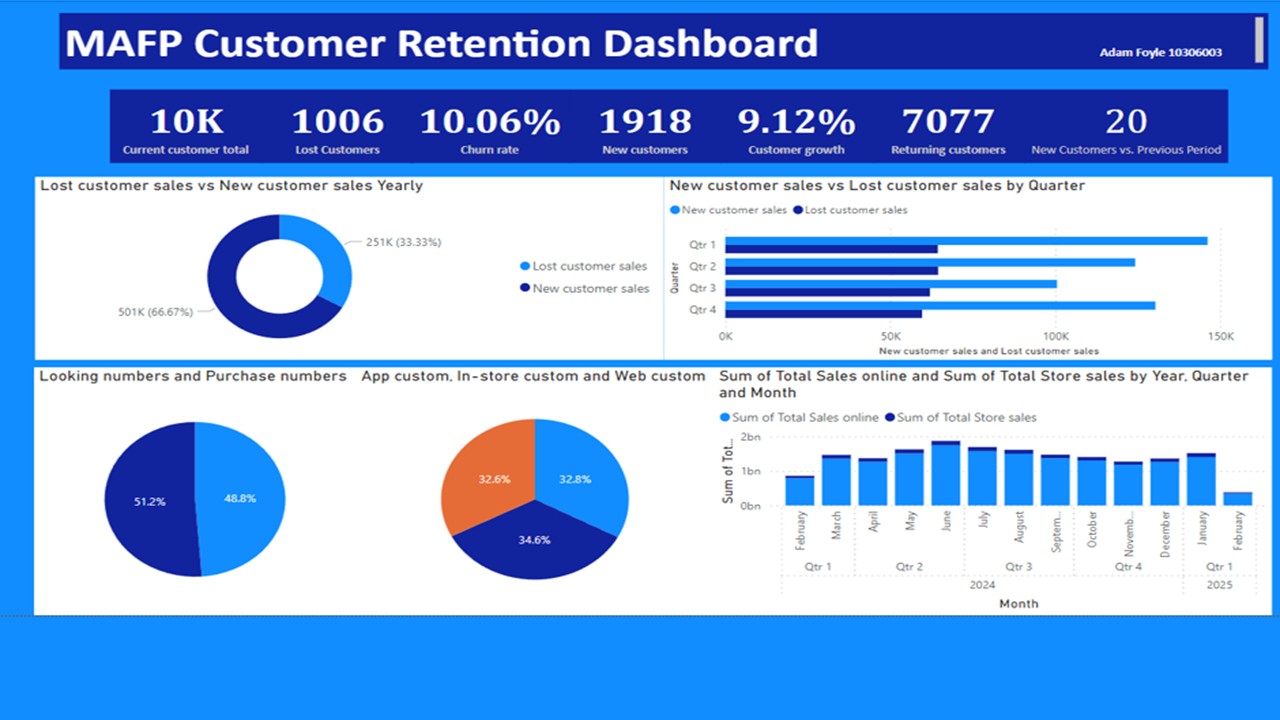
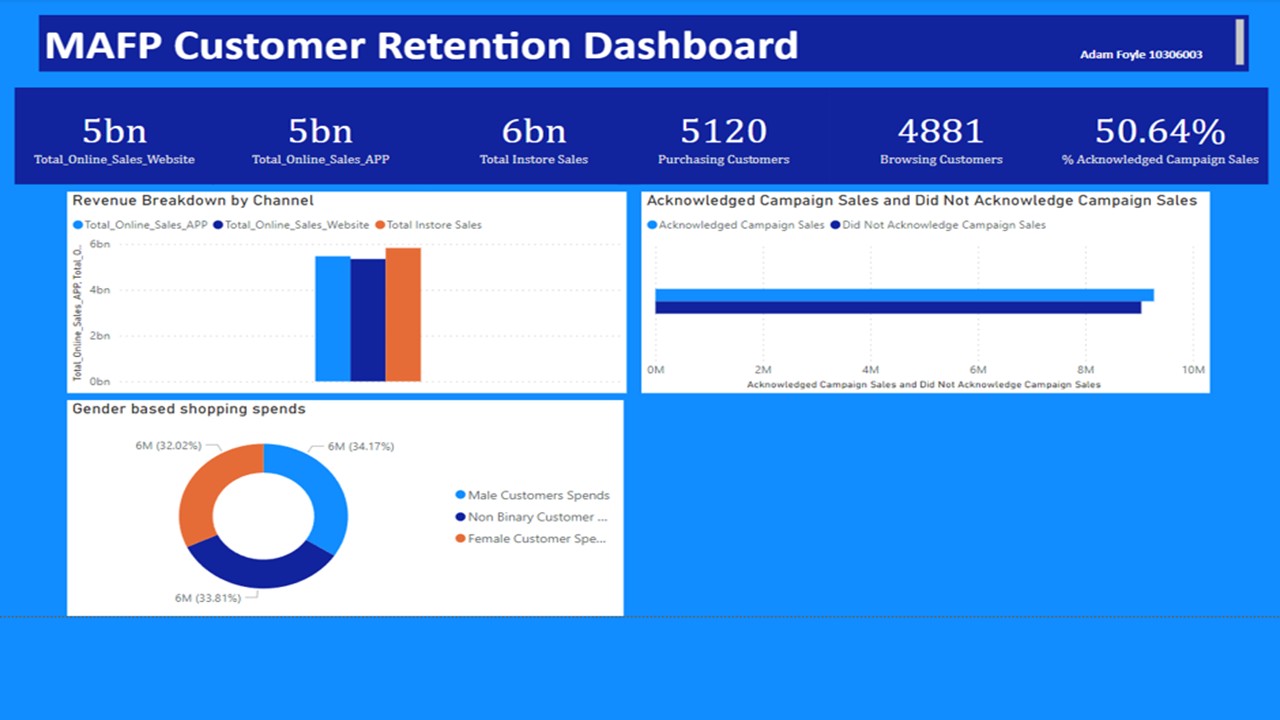
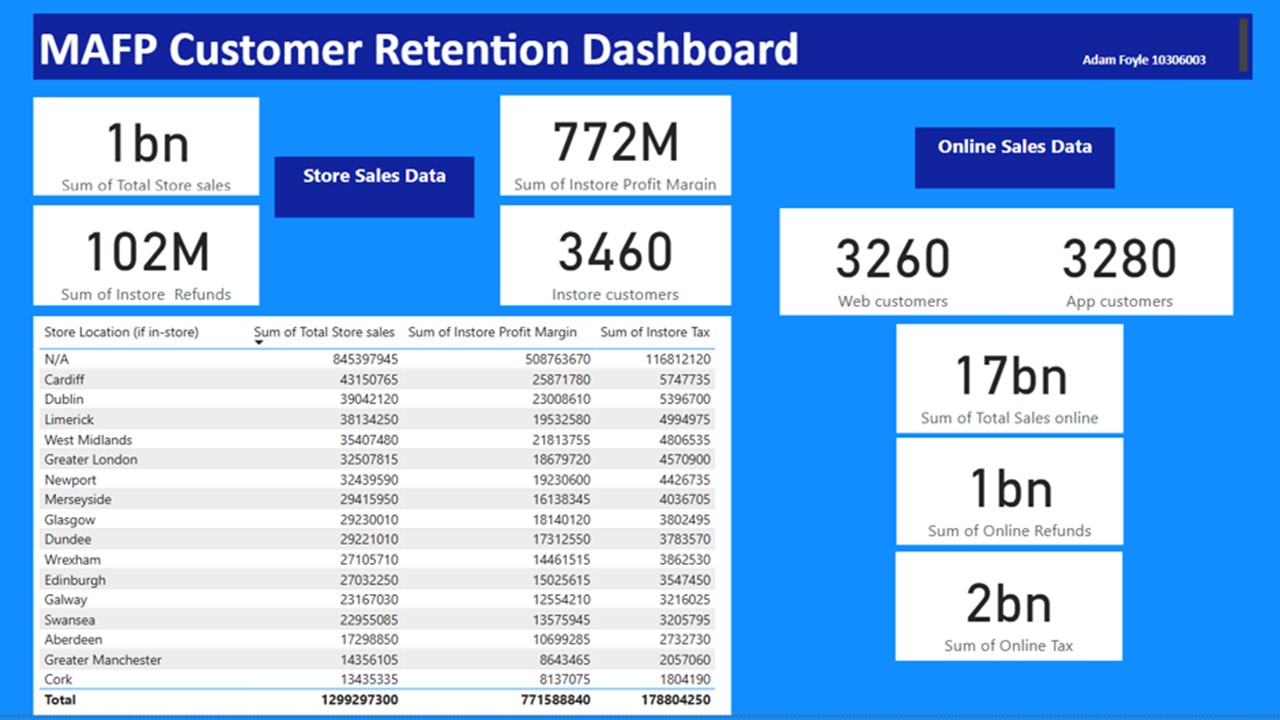
Power BI Dashboard, for fictitious company MAFP Project Industries.
Project Introduction
The Customer Retention Dashboard was developed to investigate how business
intelligence and data visualisation techniques could be used to improve
understanding of customer behaviour, sales performance and retention trends
within a retail environment.
The project focused on transforming large datasets into meaningful visual
reports capable of supporting business decision-making, operational awareness
and customer-focused analysis.
The proposed outcome was to design a business intelligence dashboard capable
of transforming raw sales and customer data into interactive visual reports
that could support business analysis and operational decision-making.
The dashboard aimed to improve visibility of customer behaviour, retention
patterns and sales performance through accessible and visually engaging
reporting techniques.
Actual Outcome
A functional business intelligence dashboard was produced using Power BI,
featuring customer retention metrics, churn analysis, sales trends,
regional performance comparisons, refund tracking and KPI-based reporting.
The completed dashboard successfully demonstrated how data visualisation and
interactive reporting tools can assist organisations in identifying patterns,
monitoring performance and supporting strategic business decisions.
Technical Implementation
The dashboard was developed using Microsoft Power BI and supported through data preparation and analysis processes using Excel-based datasets and business reporting methodologies.
The project involved data cleaning, KPI identification, visual design, interactive filtering and dashboard layout planning to ensure that the information presented was both accessible and meaningful to end users.
Consideration was also given to how business intelligence systems can support strategic decision-making through clearer visibility of operational trends and customer activity.
Business Insights
The dashboard highlighted how business intelligence tools can support organisations by identifying customer retention trends, sales performance patterns and operational weaknesses that may otherwise remain hidden within large datasets.
The project demonstrated the value of visual reporting for supporting management awareness, improving strategic planning and enabling data-driven decision-making.
This project strengthened my understanding of business intelligence, data visualisation, dashboard design and the importance of presenting complex information in a clear and meaningful format.
The development process highlighted the importance of data quality, report structure and user-focused visual communication when designing analytical systems.
Future improvements could include real-time data integration, predictive analytics, automated reporting and enhanced customer segmentation models.